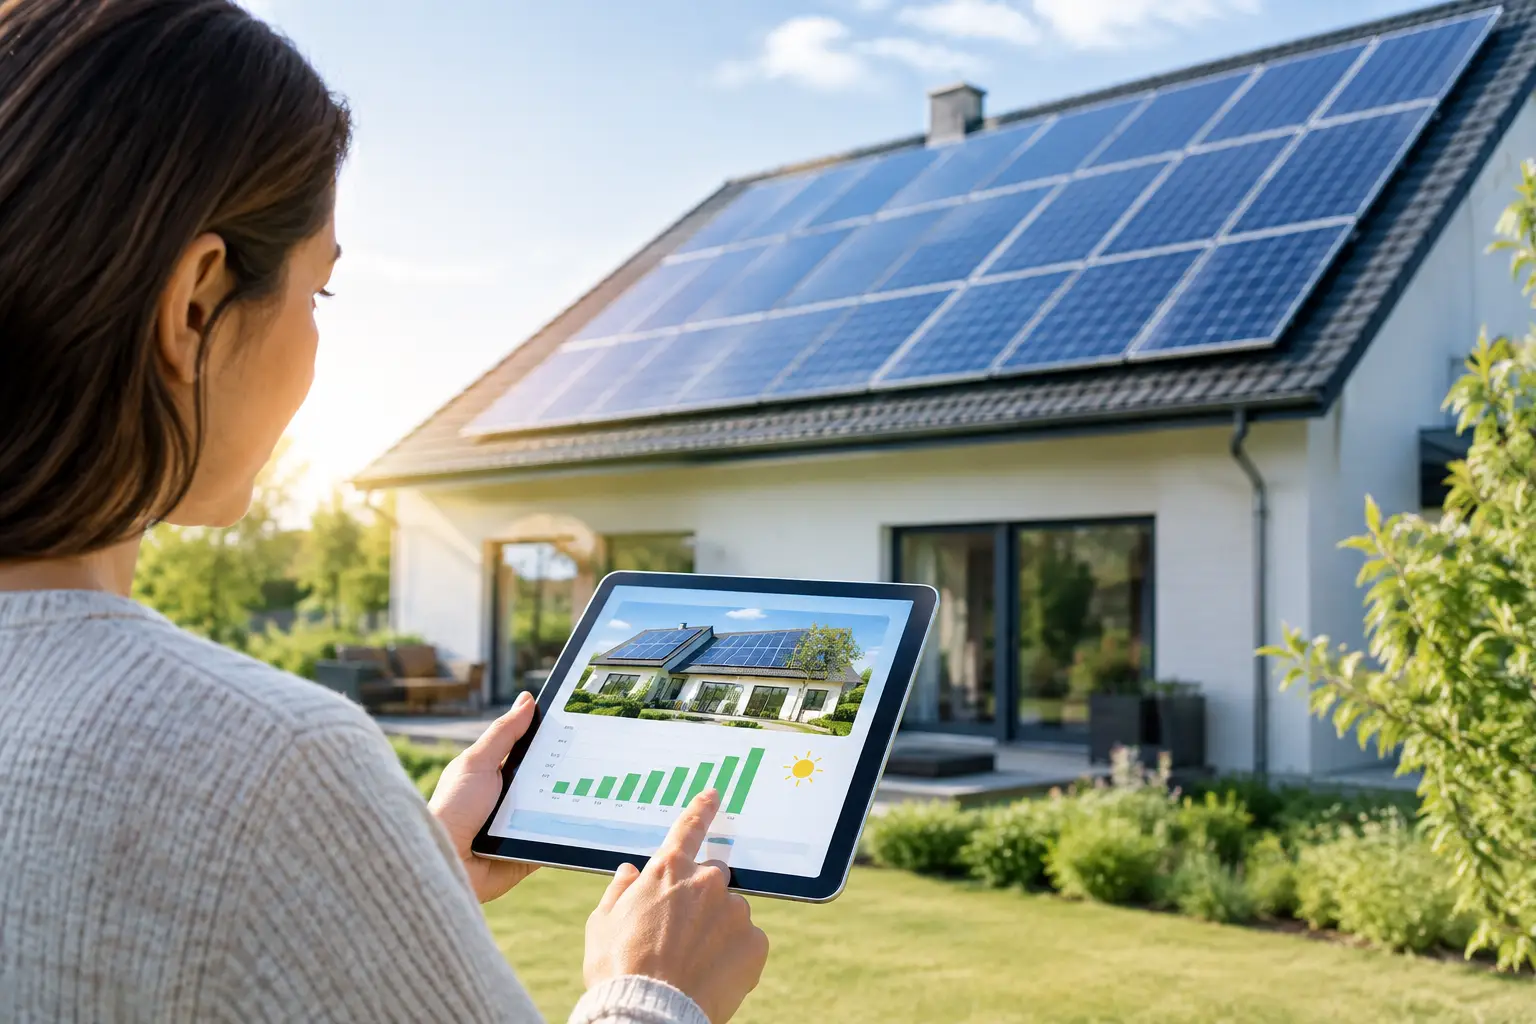
A solar proposal can make an installation look simple: a system size, an annual production number, and an estimated bill reduction. But that production number carries much of the financial decision. A reliable guide to solar production estimates helps you understand whether the forecast reflects your home, your utility rules, and the conditions your system will actually face.
Production estimates are not guarantees. They are informed projections based on location, equipment, roof geometry, weather data, and modeling assumptions. The goal is not to find a quote that promises the highest output. It is to identify an estimate that is transparent, reasonable, and useful for comparing solar options.
What a solar production estimate tells you
A solar production estimate projects how much electricity a solar system should generate over a period of time, usually expressed in kilowatt-hours (kWh) per year. For context, your utility bill also measures household electricity consumption in kWh. Comparing the two is how an installer estimates how much of your usage solar may offset.
If a proposal forecasts 10,000 kWh of first-year production and your household uses 12,000 kWh annually, the system may offset much of your yearly consumption. It does not mean your home will produce and consume power in the same pattern every day. Solar output peaks during daylight hours and changes by season, while household demand may rise in the evening or during hot summer nights.
That difference matters when evaluating savings. The value of each solar kWh depends on your utility's net metering, net billing, time-of-use rates, and fixed charges. Production is the starting point. The utility rate structure determines much of the financial result.
The inputs behind solar production estimates
A professional estimate should be built from more than your ZIP code and a generic system size. Several connected inputs shape the result.
Location and sunlight data
Solar systems generate more electricity where annual solar irradiance is higher, but local weather patterns matter as much as broad regional reputation. A home in Arizona may have strong annual output, while a home in New Jersey can still produce enough electricity for a compelling solar investment. Modern modeling tools use historical weather and irradiance data to estimate expected sunlight over many years.
This data is useful, but it cannot forecast next July's cloud cover or the exact conditions over the next 25 years. Treat a production estimate as a long-term average, not a monthly promise.
System size and panel efficiency
System size is generally stated in kilowatts (kW), which describes the system's rated power under standard test conditions. A 7 kW system and a 10 kW system will not necessarily produce output in exact proportion if their roofs face different directions or have different shading conditions. Still, size is one of the clearest drivers of annual production.
Panel efficiency affects how much rated capacity can fit into a limited roof area. Higher-efficiency panels can be valuable when usable roof space is tight. They do not automatically produce more electricity per installed kW than other quality panels under the same conditions. For many homeowners, roof layout and total system design matter more than choosing the panel with the highest efficiency rating.
Roof direction, tilt, and usable area
In most of the United States, south-facing panels typically receive the strongest annual sunlight. East- and west-facing arrays can also be productive and may be a practical choice when the roof layout supports them. West-facing panels can have added value under some time-of-use rate plans because they generate more electricity later in the afternoon, when electricity prices may be higher.
Roof tilt affects output too, although the difference is often smaller than homeowners expect. A roof does not need to be perfectly angled to make solar worthwhile. What matters is whether the installer has modeled each roof plane accurately rather than applying one idealized assumption to the entire system.
Shading and obstructions
Trees, chimneys, vent pipes, neighboring buildings, and roof features can reduce production. Shade is especially important because it may vary significantly through the day and across seasons. A tree that appears harmless in winter may cast meaningful shade once it leafs out.
Ask how shading was assessed. Satellite imagery can provide an early estimate, but an on-site review may reveal obstructions that aerial images miss. If tree trimming or removal is part of the plan, make sure the production estimate clearly states whether that work is assumed.
Equipment and system losses
Solar panels do not send every watt they produce to your home's electrical panel. Real-world systems have expected losses from inverter conversion, wiring, temperature, soiling, panel mismatch, and other operating factors. Good estimates account for these losses rather than presenting laboratory-style output.
The model should also account for gradual panel degradation. Most panels are expected to produce a little less electricity each year. A first-year estimate is useful, but a long-term financial proposal should show how projected production changes over time.
How to read a solar production estimate
Start by finding the first-year annual production figure, then compare it to the electricity usage on your last 12 months of utility bills. Using a full year matters because it captures seasonal air conditioning, heating, pool equipment, electric vehicle charging, and other changes in consumption.
Next, look for the specific production metric: annual kWh per installed kW. Divide projected annual production by system size. For example, a 9 kW system projected to produce 12,600 kWh has an estimated production ratio of 1,400 kWh per kW. That ratio is not a universal quality score. It varies by state, roof orientation, shade, and climate. It does, however, help you spot estimates that seem unusually high or low for similar designs.
Then separate production from offset. A proposal might show a 100% offset, but that claim depends on the usage baseline and the rules used to value exported power. If your family adds an EV, replaces a gas appliance with a heat pump, or builds an addition, your electricity use may increase. If you expect a major usage change, ask for an updated model.
Questions to ask before relying on the numbers
A credible installer should be able to explain the assumptions behind the forecast in plain language. Ask whether the estimate is based on satellite imagery, a site visit, or both. Confirm the assumed roof orientations, tilt, shading losses, and annual degradation rate.
Also ask whether the system includes every panel shown in the design and whether the modeled equipment matches the equipment listed in the contract. A proposal can change between the sales stage and final engineering because of roof measurements, electrical constraints, permitting requirements, or utility interconnection rules. You should know whether a design change will alter projected production and savings.
If a performance guarantee is offered, read its terms closely. Guarantees may apply only after a waiting period, require monitoring to remain active, exclude shading from new vegetation, or provide a limited remedy. A guarantee can add confidence, but it does not replace a careful review of the estimate.
Why two estimates can differ
It is common for two installers to offer different production forecasts for systems with similar sizes. One may use more conservative weather data, model shading differently, assume different equipment losses, or place panels on different roof planes. The higher number is not automatically better.
Compare the underlying design first. Look at system size, panel count, panel placement, inverter type, roof sections used, and annual kWh forecast. Then compare the financial model, including the utility rate assumptions and the treatment of excess generation. A smaller system with a realistic forecast and a better-aligned design can be more valuable than a larger system built around optimistic assumptions.
Set the right expectation after installation
Once the system is operating, monitor it monthly and compare output with the proposal's expected seasonal pattern. Do not judge annual performance from one cloudy month or a short period after activation. Production naturally rises and falls with the seasons.
If output appears consistently lower than expected, check for system alerts, newly developed shade, unusually heavy soiling, or changes in utility reporting. Your installer should be able to review monitoring data and determine whether the system is operating normally.
The best solar estimate is not the one that makes the savings chart look most impressive. It is the one that clearly shows what your roof can reasonably produce, what assumptions support that number, and how that electricity will work within your household's actual energy plan.